Oregon's 674,000-Acre Fire Siege Started With One Night of Lightning
The usual explanation for a season like this is heat and drought. So we ranked eastern Oregon's summer against 36 years of NOAA station data. It came back 9th driest and 12th hottest — nowhere near a record. The thing that actually broke was ignition.
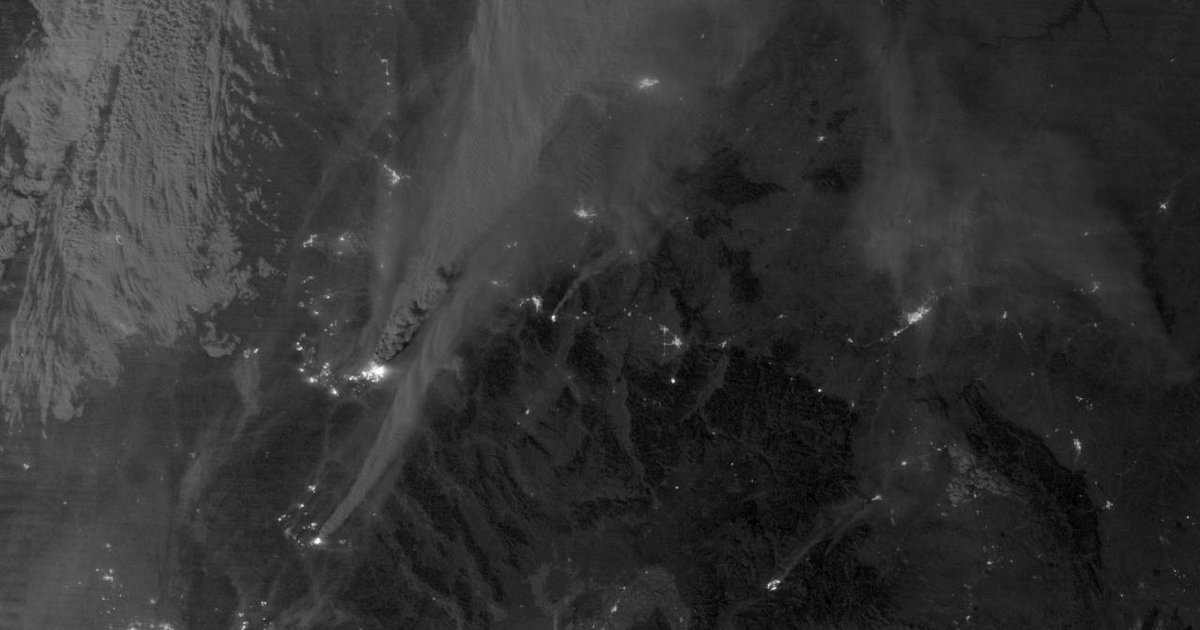
Oregon has 76 active wildfires and at least 674,874 acres burned as of July 22, 2026 — and almost all of it arrived in a single week. On July 15, more than 2,000 lightning strikes hit Central Oregon and ignited over 50 fires in one day. Within 72 hours the count passed 85.
The reflexive explanation is drought and heat. We tested it against our archive of 139 million NOAA daily weather records, which covers eastern Oregon well. It does not hold up.
Measured across 31 long-record stations east of the Cascades, April 1 through July 22 came in at 76% of the 1991–2020 normal — the 9th driest of the last 36 years, not the first. Mean daily highs for June 1–July 22 ranked 12th warmest of 36. Both are on the dry, warm side of the ledger. Neither is remarkable. In 2021, the heat-dome summer, eastern Oregon got less than half this year's rain and ran nearly 7°F hotter.
So the weather this summer was not the outlier. The lightning was.
The fires burning right now
These are the largest active incidents from the NIFC/WFIGS feed that powers our live wildfire tracker, snapshotted July 24. Two caveats worth knowing, because they trip up most coverage: acreage and containment change several times a day, and incidents get merged into complexes mid-season. The Hoag Fire below is now reported inside the Hay Creek Complex, so these rows cannot simply be added up to a state total.
| Fire | Acres | Contained | Location |
|---|---|---|---|
| Rowe Creek Complex | 151,431 | 31% | Wheeler County, southwest of Fossil |
| Hay Creek Complex | 149,672 | 60% | Gilliam County, west of Highway 19 |
| Crosswhite | 123,822 | 20% | Wheeler County |
| Porcupine Ridge | 80,055 | 13% | Gilliam / Wasco County |
| Hoag | 50,224 | 99% | Gilliam County (now reported within Hay Creek) |
| Brewer | 32,707 | 5% | Crook / Jefferson County |
| Big Grass | 30,000 | 0% | Malheur County, southeast Oregon |
| Akawa Butte | 26,144 | 5% | Jefferson County |
The geography is tight. Wheeler, Gilliam, Wasco, Jefferson and Crook counties — the John Day River country of north-central Oregon — hold the bulk of the acreage. Our wildfire history hub collects the individual event pages and the historical record behind them. The Rowe Creek Complex is burning about a mile east of John Day Fossil Beds National Monument. This is rangeland and juniper steppe, not the wet Douglas-fir forest most people picture when they hear “Oregon.”
July 15: 8,199 strikes in 24 hours
A dry thunderstorm system crossed the Pacific Northwest on the night of July 15, 2026. Detection networks logged 8,199 lightning strikes across Oregon and Washington in 24 hours, more than 2,000 of them in Central Oregon alone. A KGW meteorologist ranked it among the five most active storms of a broadcasting career.
Central Oregon Fire Management Service and the Oregon Department of Forestry reported more than 50 new fires from that night's strikes. Most stayed under a tenth of an acre. A dozen did not. Fire agencies list lightning as the cause of the Crosswhite, Brewer, Akawa Butte, Porcupine Ridge, Coyote and Box Springs fires — and the start dates cluster almost perfectly: July 15, 16 and 17.
That clustering is the whole story. A fire season with one 150,000-acre fire is a bad break. A fire season with a dozen simultaneous large fires is a resource problem, because every one of them wants the same crews, engines and aircraft on the same afternoon.
The timing could hardly have been worse. On July 18 — three days after the outbreak — the National Multi-Agency Coordinating Group raised the national wildfire preparedness level to PL5, the top of the scale, for the first time since October 2024. PL5 means resources are fully committed and managers must take emergency measures to keep operations running. Oregon's dozen new large fires were competing for help from a system that had just run out of slack. Nationally, 3,912,187 acres had burned year-to-date as of July 23, about 135% of the 10-year average.
We ranked this summer against 36 years. It came 9th.
Here is eastern Oregon's April 1–July 22 rainfall, driest years first, from our matched-station panel. Using the same stations in every year matters: station networks turn over, and comparing a 63-station year to a 108-station year produces nonsense.
| Rank | Year | Apr 1–Jul 22 rain | |
|---|---|---|---|
| 1 | 2021 | 2.61" | The heat-dome year. Also the hottest June–July in the record. |
| 2 | 2025 | 2.91" | Last summer — drier than this one. |
| 3 | 1999 | 4.07" | |
| 4 | 2000 | 4.19" | |
| 5 | 2002 | 4.27" | |
| 6 | 2007 | 4.77" | |
| 7 | 2016 | 4.88" | |
| 8 | 2024 | 5.25" | |
| 9 | 2026 | 5.39" | This year — 76% of normal, and only the 9th driest of 36. |
| 10 | 2014 | 5.53" |
The average across the panel was 5.39 inches against a 7.14-inch normal. Real deficit, real drought stress — and still 8 years since 1991 were drier, including last summer.
Splitting the season in two sharpens it. April 1–May 15 ran at 95% of normal — an ordinary spring. It was May 16 onward that fell away, to 60% of normal. So eastern Oregon entered fire season with a normal spring behind it and then simply stopped getting rain, which is the usual seasonal script here, run slightly harder than average.
In fire country itself, the 60 days before ignition were close to normal
Zoom from “eastern Oregon” down to the specific high-desert box where the big fires are burning, and the drought explanation weakens further. Here is the rain that fell in the 60 days before the lightning outbreak — May 16 to July 15 — at every long-record station inside the fire zone, against that station's own 1996–2025 average for the identical window.
| Station | 2026 | Normal | Prior years drier | Days with ≥0.10" |
|---|---|---|---|---|
| Arlington | 0.80" | 0.90" | 17 of 29 | 2 |
| Redmond Airport | 0.97" | 1.31" | 13 of 28 | 2 |
| Pelton Dam | 1.08" | 1.29" | 14 of 29 | 1 |
| Antelope 6 SSW | 1.41" | 2.14" | 10 of 26 | 4 |
| Ochoco Meadows | 2.39" | 3.00" | 12 of 30 | 14 |
| Derr | 2.90" | 2.92" | 17 of 29 | 10 |
Arlington recorded 0.80 inches in two months. That number looks apocalyptic until you see the normal next to it: 0.90 inches. Seventeen of the previous 29 years were drier there. Redmond was drier than 2026 in 13 of 28 years. Derr, at 2.90 inches against a 2.92-inch normal, was essentially dead average.
This is the part that gets flattened in most coverage. North-central Oregon is high desert. Across the 60 days before mid-July, its long-term normal at these gauges runs from under an inch to about three inches, and one to four days of measurable rain is the typical haul, not a drought signature. Rainfall is not the same measurement as fuel moisture — agencies track that separately — but a landscape whose normal is this dry arrives at mid-July near its seasonal driest in most years. The kindling is laid most summers. What varies is whether something lights it.
But the Drought Monitor says 88% of Oregon is in drought. Both are true.
As of July 7, 2026, the US Drought Monitor put 88% of Oregon in drought (D1 or worse), with 20.3% in extreme drought and none in exceptional. County drought emergencies have been declared across the state. That is not in tension with what we found — the two measure different things.
The Drought Monitor is an integrated index. It weighs multi-year precipitation deficits, snowpack, soil moisture, streamflow and reservoir storage, and it responds slowly to accumulated shortfall. Oregon has genuinely been running a moisture debt for several years, and that shows up in live fuel moisture, in soil, and in water supply. Our number is narrower and more literal: how many inches fell out of the sky at these gauges, in this window, versus the long-term average for that same window.
A place can be in severe long-term drought and still have had a fairly ordinary two months of rainfall. That is exactly eastern Oregon in 2026. It matters for how you read the season: the multi-year deficit set the stage, but it did not distinguish this July from the July before it, or the one before that. Something else did. See our nationwide 2026 drought analysis for how Oregon's deficit compares to the rest of the country — the largest rainfall shortfalls this year are in the Southeast, not the West.
The heat was real, but it was not 2021
Eastern Oregon's mean daily high for June 1–July 22 was 75.8°F this year, 12th warmest of the 36 years in the panel. The record is 2021 at 82.3°F — the summer of the Pacific Northwest heat dome, which was also the driest in the record at 2.61 inches. 2021 was extreme on both axes simultaneously. 2026 is not.
That said, the West did not cool off after the fires started. Between July 19 and 22, our records pipeline logged 34 new daily heat records in Colorado, 32 in Wyoming, 27 in Idaho and 11 in Utah. Hot, windy afternoons are what turned a tenth-acre lightning smoke into an 80,000-acre incident, and there were plenty of those. Our western heat wave analysis covers the July 11–13 heat dome that preceded the outbreak and helped cure the fuels those strikes landed in.
The obvious objection: 2021 was hotter and drier, and it burned too
Fair challenge. 2021 sits at the top of both our rankings — driest April–July of the 36 years and hottest June–July — and it was a brutal fire year. The Bootleg Fire alone burned 413,765 acres before containment on August 15, and Oregon finished the 2021 season with 827,596 acres across 1,661 fires. If extreme weather drives extreme fire seasons, 2021 is the case for the prosecution.
Which is precisely what makes 2026 worth writing about. Oregon has already burned 674,874 acres by July 22 — about 82% of the entire 2021 total — with two or more months of fire season still to run, in a summer that ranks 9th driest and 12th hottest rather than 1st and 1st. 2021 needed record heat and record drought to produce that number. 2026 is closing on it with neither.
The honest reading is not that weather stopped mattering. Warm, dry, windy afternoons are still what carried these fires. It is that in a landscape which reaches burnable condition nearly every summer, the weather does not have to be exceptional for the outcome to be. Once fuels are receptive — which happens most years here — the variable that decides the season is how many ignitions arrive at once, and whether there are crews left to send.
Track these fires live
Acreage and containment in this article are a July 24 snapshot and will be out of date within a day. Our live tracker pulls current perimeters, size and containment straight from the NIFC/WFIGS incident feed for every large fire in the country.
Open the live wildfire map →What to watch next
Three things will decide how this season ends. First, containment on the uncontained incidents — Big Grass at 0%, Brewer at 5% and Akawa Butte at 5% are the ones with room to run. Second, whether another dry-lightning system crosses the region before autumn rain arrives; north-central Oregon typically gets no meaningful rain until late September, so the fuel side of the equation will not improve on its own for two more months. Third, national resource availability: as long as the country sits at PL5, Oregon competes with every other active geographic area for the same crews.
The longer-term wildcard is the developing super El Niño. Strong El Niño winters historically skew the Pacific Northwest drier and warmer, which would carry this moisture deficit into 2027 rather than erase it — the opposite of what the Southwest usually gets. Our 2026 wildfire season and El Niño analysis works through that relationship, and the worst wildfires in US history puts 674,000 acres in perspective against the seasons that redefined the term.
The weather history behind the smoke
Smoke from these fires has pushed air quality across the state, and the nearest population centers to the fire zone are feeling it most. You can pull the full daily record — every high, low and rainfall total we hold — for Bend, the closest city to the Jefferson and Crook County fires, plus Portland, Salem and Eugene downwind in the Willamette Valley. For the statewide extremes — Oregon's all-time hottest and driest marks — see our Oregon weather records page, and compare it with neighbouring Washington and Idaho, both of which took strikes from the same storm system. Visitors headed to Crater Lake can check its month-by-month climatology before booking a smoke-season trip.
Frequently asked questions
How many acres have burned in Oregon in 2026?
At least 674,874 acres across 76 active wildfires as of July 22, 2026. Nearly all of that total was added after July 15, when a single lightning outbreak ignited more than 50 fires in one day.
What caused the Oregon wildfires in July 2026?
Lightning. More than 2,000 strikes hit Central Oregon on July 15, 2026, with 8,199 recorded across Oregon and Washington in 24 hours. Fire agencies list lightning as the cause of the Crosswhite, Brewer, Akawa Butte, Porcupine Ridge, Coyote and Box Springs fires, all of which started July 15–17.
Was 2026 an unusually dry year in eastern Oregon?
Dry, but not exceptional. Our NOAA station analysis puts April 1–July 22 at 76% of the 1991–2020 normal — the 9th driest of the last 36 years. 2021 and 2025 were both substantially drier. The June–July heat ranked 12th of 36.
If the weather was not extreme, why is the fire season so bad?
Because ignition, not dryness, was the variable. North-central Oregon high desert is cured and receptive by mid-July in almost any year — at Arlington, 17 of the previous 29 years were drier over the same 60-day window. What made 2026 different was thousands of simultaneous ignitions landing when national firefighting resources were already committed.
How does 2026 compare to Oregon’s 2021 fire season?
Oregon burned 827,596 acres across 1,661 fires in all of 2021, including the 413,765-acre Bootleg Fire. 2026 has reached 674,874 acres by July 22 — roughly 82% of that total with months of season left — despite ranking only 9th driest and 12th hottest of the last 36 years, where 2021 ranked first in both.
What is Preparedness Level 5?
The top of the national 1-to-5 wildfire scale. It means firefighting resources are fully committed and managers must take emergency measures to sustain operations. The National Multi-Agency Coordinating Group moved to PL5 on July 18, 2026 — the first time since October 2024.
Where can I see which Oregon fires are burning right now?
Our live wildfire tracker pulls current perimeters, acreage and containment directly from the NIFC/WFIGS incident feed and updates through the day.
Methodology
Precipitation and temperature figures were computed on July 24, 2026 from our archive of NOAA GHCN-Daily records (the 139-million-row dataset behind our city weather-history tool), with data current through July 22, 2026. Precipitation is stored in tenths of a millimetre (inches = value ÷ 254) and daily highs in tenths of °F. The eastern Oregon panel is every Oregon station east of longitude −121.5 whose record begins by 1991 and continues through July 2026; each station's seasonal total is compared to that same station's 1991–2020 mean for the identical calendar window, so station turnover cannot bias the ranking. Station-years require at least 100 reporting days (40 for the temperature panel) to qualify; 31 stations met the precipitation criteria and 64 the temperature criteria. The fire-country panel is the box bounded by latitude 44.2–45.8 and longitude −121.6 to −119.6, using stations with records back to 1996, compared against the 1996–2025 mean. Fire acreage, containment and locations are from the National Interagency Fire Center WFIGS incident feed (snapshot July 24, 2026, 06:00 UTC) and are not our data; because incidents merge into complexes mid-season, individual rows should not be summed to a state total. The 674,874-acre statewide figure and 76-fire count are as reported for July 22, 2026 by KOIN. Lightning-strike counts are from KGW and KTVZ; fire causes and start dates from agency reporting compiled at 2026 Oregon wildfires. The 2021 comparison figures — the 413,765-acre Bootleg Fire and Oregon's 827,596-acre, 1,661-fire season total — are from published season summaries, not our data. Drought coverage percentages are from the US Drought Monitor for July 7, 2026. National preparedness level and year-to-date acreage are from NIFC and the National Interagency Coordination Center as of July 18 and July 23, 2026 respectively.