Hurricane Polo’s Remnants Aim 2 to 8 Inches at Texas and the Southwest — Onto Ground That’s Already the Wettest in Years
The forecast totals aren’t record-breaking. What they land on might make them dangerous anyway: Albuquerque’s last two weeks already out-rained its wettest October ever.
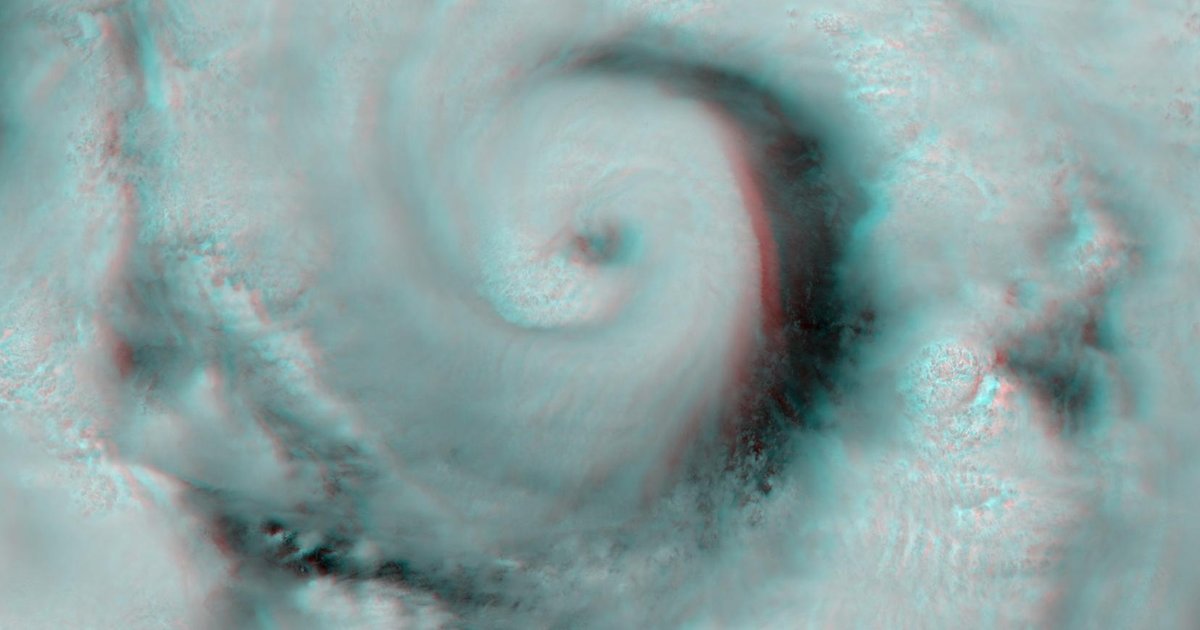
The remnants of Hurricane Polo, wrung out by a plunging jet stream, will drop a widespread 2 to 4 inches of rain — locally up to 8 — across Texas and the Southwest between Wednesday and Friday, October 1–3, 2026. By the morning of September 30, the National Weather Service had Flood Watches up across roughly a dozen states and about a dozen Flash Flood Warnings running in Arizona and New Mexico. The forecast totals are heavy but not historic. The reason forecasters keep using the word “dangerous” is what the rain is falling on.
Albuquerque’s rain gauge caught 3.29 inches in the two weeks ending September 26, 2026 — more than the city’s wettest October in the entire 1970–2026 record (3.08 inches, set in 1972) — and all of that fell before Polo’s moisture arrived. El Paso and Amarillo just logged one of their wettest Septembers ever. When new rain lands on soil that is already saturated, almost none of it soaks in; it runs straight into the arroyos and low-water crossings.
The ground is already soaked — and that’s the story
Three cities in the moisture plume’s path spent September filling up. We pulled each one’s full daily record from our NOAA archive and ranked this September against every other:
- Albuquerque has had its second-wettest September on record (3.31 inches through the 26th, against a 1.15-inch normal — behind only 2013’s 3.97 inches). Its two-week total, 3.29 inches, is larger than the wettest calendar October the city has ever recorded. NWS Albuquerque called the incoming plume a “near-record to record surge of moisture” with a “moderate to high risk of flash flooding.”
- Amarillo is at its third-wettest September on record — 4.56 inches, or 270% of normal. NWS Amarillo warned of a “high-end rain event” for the Texas and Oklahoma panhandles.
- El Paso has taken 3.41 inches this month, more than double its 1.52-inch normal, with 2.98 of those inches in the final two weeks. The local NWS office was blunt: “heavy rainfall last week has saturated soils.”
This is the same tropical-moisture engine that drives the Arizona monsoon, stretched into late September and pointed at higher terrain. On saturated ground, a 2-inch hour — and the NWS is warning of rates of 1 to 3 inches per hour — is all it takes.
What 2 to 8 inches means, city by city
Here is the forecast next to what each gauge has actually recorded since 1970. Read it two ways: the parched Texas cities (Austin at 0.00 inches for the month, Dallas at 0.01) have hard, baked ground that sheds water almost as fast as saturated soil does, while the New Mexico and Panhandle cities are already brimming. Both are flash-flood setups.
| City | This event (forecast) | Wettest day on record | Wettest October ever | Sept 2026 vs. normal |
|---|---|---|---|---|
| Albuquerque, NMsoaked | Moderate–high flash-flood risk | 1.92 in (Apr 3, 2004) | 3.08 in (1972) | 3.31 in vs 1.15 in normal |
| Amarillo, TXsoaked | “High-end rain event” (NWS) | 5.74 in (Jul 7, 2010) | 6.48 in (1998) | 4.56 in vs 1.69 in normal |
| El Paso, TXsoaked | Repeated rounds, up to 4 in | 2.84 in (Aug 1, 2006) | 3.24 in (2015) | 3.41 in vs 1.52 in normal |
| Austin, TX | 2–4 in, isolated 8 in | 12.49 in (Oct 30, 2015) | 21.15 in (2015) | 0.00 in vs 3.14 in normal |
| San Antonio, TX | 2–4 in, isolated 8 in | 11.26 in (Oct 17, 1998) | 18.07 in (1998) | 0.42 in vs 3.88 in normal |
| Dallas–Fort Worth, TX | 2–4 in, localized 4–6 in | 5.85 in (Sep 21, 2018) | 15.66 in (2018) | 0.01 in vs 2.72 in normal |
| San Angelo, TX | “Considerable flash flooding possible” (NWS) | 6.24 in (Sep 9, 1980) | 11.37 in (2018) | 0.56 in vs 2.51 in normal |
| Oklahoma City, OK | 2–4 in, up to 6 in | 7.62 in (Jun 14, 2010) | 13.18 in (1983) | 0.22 in vs 3.72 in normal |
| Lubbock, TX | Flood Watch, Wed–Thu | 7.46 in (Sep 11, 2008) | 10.80 in (1983) | 2.49 in vs 2.55 in normal |
| Midland–Odessa, TX | Flood Watch, Wed–Thu | 4.66 in (Sep 28, 2012) | 7.45 in (1986) | 0.58 in vs 1.66 in normal |
| Tucson, AZ | Additional 2–4 in (Southwest) | 2.96 in (Oct 1, 1983) | 4.99 in (2000) | 0.43 in vs 1.32 in normal |
| Phoenix, AZ | Lighter — plume clips the metro | 3.30 in (Sep 8, 2014) | 5.35 in (2018) | 0.36 in vs 0.57 in normal |
Wettest-day and wettest-October figures are single-station totals from the primary airport gauge in each city (1970–2026); localized storm maxima can run higher. Forecast wording is from each city’s NWS Flood Watch, pulled September 30, 2026.
Central Texas has done exactly this before — in October
The Hill Country floods in the fall for a specific reason: dying eastern-Pacific tropical systems throw a river of moisture into a stalled front over the Balcones Escarpment, where the terrain wrings it out over creeks that rise in minutes. That is the Polo setup, and it has a body count.
On October 17–18, 1998, that pattern dropped up to 22 inches on the San Antonio–Austin corridor and killed 31 people, most of them swept from vehicles along the Guadalupe River. San Antonio’s wettest day in our entire record — 11.26 inches — is still that date. Kerr, Comal and Kendall counties, in the same Hill Country flash-flood corridor that 1998 tore through, are all inside this week’s Flood Watch. Austin’s own wettest day ever, 12.49 inches, was likewise an October event, on Halloween 2015.
None of this week’s forecast totals reach those marks. The point is the opposite: it doesn’t take a record to be deadly here. For the longer view, see our ranking of the worst floods in US history and how Texas fares in a century of tropical systems.
Where the water heads next: a Plains-to-Midwest stripe
This isn’t only a Southwest story. The Weather Channel maps a separate 3-to-5-inch band — locally more — running from Kansas through southern Nebraska, northern Missouri, southern Iowa and northern Illinois as the same moisture rides the jet stream northeast. By Thursday the heaviest axis parks over Dallas–Fort Worth and the Hill Country; by the weekend, days of rain reach the Southeast.
Oklahoma City is the mirror image of Albuquerque here — one of its driest Septembers on record (0.22 inches against a 3.72-inch normal). Two to four inches on ground that hard produces its own flash-flood problem, just from a different starting point.
Check your own total against the record
If you’re under one of these watches, the number that matters is your own. When the rain stops, look up what your city has done before with our weather-history lookup — type any past date and location to see the daily rainfall on record — or browse the ranked rainiest cities in America and the Texas state records. Caught a total that beats the table above? That’s the kind of gauge reading we fold into the next update. We’ll revise this page with observed totals once the event wraps around October 3.
Frequently Asked Questions
How much rain will Texas and the Southwest get from Hurricane Polo’s remnants?
The National Weather Service is forecasting a widespread 2 to 4 inches of rain across Texas and the Southwest between October 1 and 3, 2026, with isolated totals up to 8 inches in the Hill Country and along Interstate 35. The Weather Channel adds a separate 3-to-5-inch stripe from Kansas through the Midwest. The moisture comes from the decaying remnants of Hurricane Polo drawn north by a plunging jet stream.
Is this going to break rainfall records?
Not on a single-day basis. Even an isolated 8-inch total in Austin would fall short of the city’s wettest day on record, 12.49 inches on October 30, 2015. The real danger is timing, not magnitude: Albuquerque, El Paso and Amarillo just posted one of their wettest Septembers on record, so the rain is landing on ground that is already saturated and quick to run off.
Why is flooding so dangerous when the ground is already wet?
Saturated soil has little capacity left to absorb new rain, so almost all of it becomes runoff that funnels into creeks and low water crossings within minutes. Albuquerque’s rain gauge caught 3.29 inches in the two weeks ending September 26 — more than its wettest October in the entire 1970–2026 record — before this event even began. That is why the NWS in Albuquerque called the incoming moisture a “near-record to record surge.”
Has Central Texas flooded like this in October before?
Yes, and it is the region’s signature disaster. On October 17–18, 1998, decaying Pacific tropical moisture and a stalled front dropped up to 22 inches on the San Antonio–Austin corridor, killing 31 people along the Guadalupe River. San Antonio’s wettest day on record, 11.26 inches, is still that date. Austin’s wettest day ever, 12.49 inches, was also an October event, in 2015.
Which cities are under a Flood Watch?
As of the morning of September 30, 2026, Flood Watches covered roughly a dozen states, with the Texas–New Mexico–Oklahoma core including Austin, San Antonio, Dallas–Fort Worth, San Angelo, Amarillo, Lubbock, Midland–Odessa, El Paso, Albuquerque, Santa Fe and Oklahoma City, plus the Hill Country counties of Kerr, Bandera, Gillespie, Comal and Kendall. The NWS also had a dozen Flash Flood Warnings in effect across Arizona and New Mexico.
Sources & Method
Rainfall records and 2026 month-to-date totals were computed on September 30, 2026 from the site’s Neon copy of NOAA’s GHCN-Daily dataset, using the primary airport gauge in each city and excluding readings flagged in NOAA’s quality-control file. Records span 1970 to present.
Forecast rainfall, timing and Flood Watch wording are from the National Weather Service local offices (Austin/San Antonio, Fort Worth, San Angelo, Amarillo, El Paso and Albuquerque) and the Weather Prediction Center, pulled September 30, 2026, plus weather.com regional forecasting. The October 1998 flood figures are from the NWS South-Central Texas event summary. Forecast figures are in forecast tense and will be reconciled to observed totals after the event.