Texas Hurricane History: 18 Storms Since 1970, Ranked by the Rain They Actually Dropped
We pulled the NOAA gauge readings for 18 major Texas landfalls since 1970 and ranked them by rainfall. The order barely resembles the order you'd get by wind speed.
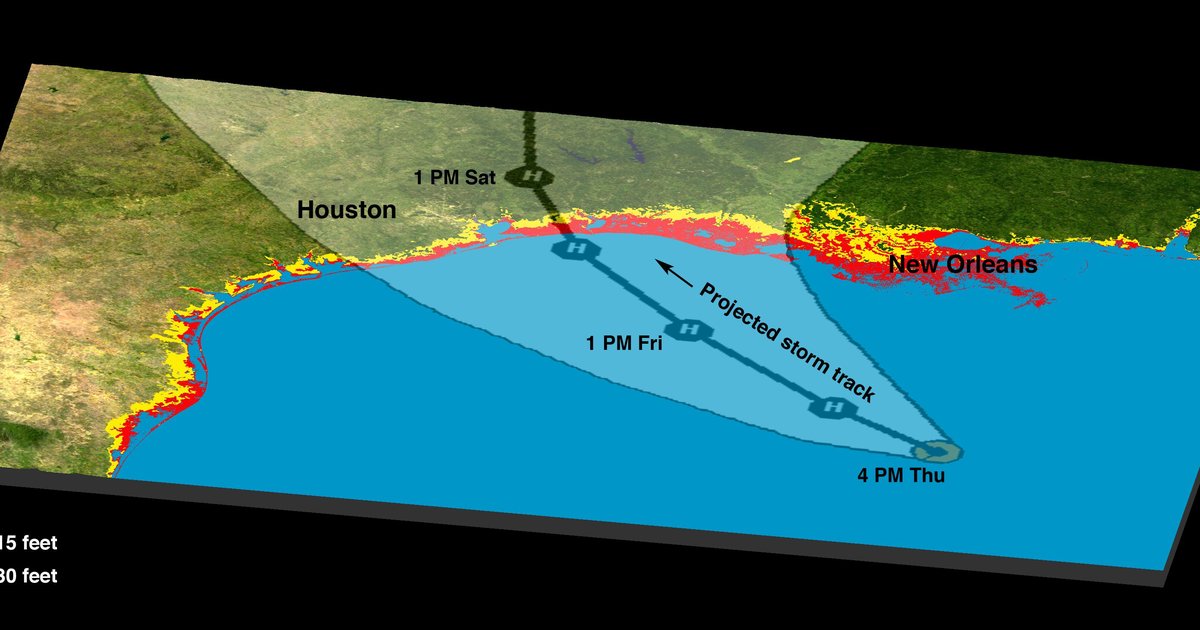
Rank the 18 biggest Texas tropical landfalls since 1970 by the rain they actually dropped and the list comes out almost backwards from the wind scale. We pulled the gauge totals from our NOAA archive for all 18 — 14 of which were hurricanes at landfall. Harvey tops it at 47.48 inches at Port Arthur in 2017.
Then it stops tracking wind entirely. Three of the next four were never hurricanes. Allison (2001), Imelda (2019) and Claudette (1979) each came ashore as a tropical storm, and each out-rained every Category 3 and Category 4 on the board except Harvey. Category 3 Celia, which tore Corpus Christi apart in 1970, left about seven inches in our gauges.
Which matters this week. Tropical Storm Bertha came ashore in St. Bernard Parish, Louisiana on July 22 and is pushing into southeast Texas today with 45-mph winds — a storm the Saffir-Simpson scale doesn't rate at all. On this record, that tells you very little about how much water it will leave behind.
Today: Bertha crosses into Texas after a Louisiana landfall
Bertha made landfall in St. Bernard Parish, Louisiana, about 40 miles east of New Orleans, at 2:00 p.m. CT on July 22. As of NHC Advisory 16 (4:00 a.m. CDT, July 23, 2026) it was centered near 29.0°N 92.2°W with 45-mph sustained winds and a 1003-mb central pressure, moving west at 13 mph, with a Tropical Storm Warning from the Terrebonne/Lafourche Parish line, Louisiana to Sargent, Texas. That advisory put storm-total rainfall at 2 to 4 inches, isolated to 6 inches along the Texas coast. Forecast guidance is being revised through the day — treat those figures as a snapshot, not a final total.
For scale: on an average July day Houston Intercontinental collects 0.12 inches of rain, and only 19 of the 57 July 23rds since 1970 have registered any measurable rain at all. Bertha's forecast total is a multi-day figure across a warning area spanning two states, so it isn't a like-for-like comparison with a single calendar day — but it is worth knowing that the wettest single July 23 in Houston's record since 1970 is just 2.07 inches (1990). A few inches of rain is ordinary for a tropical system and genuinely unusual for late July here.
Bertha is also the second named storm of 2026 to reach Texas. Tropical Storm Arthur came ashore near Matagorda Bay on June 17 and prompted a 101-county emergency declaration; our gauges caught 7.53 inches at Rockport, which by the standards of this table is unremarkable. Two systems have now pushed into Texas before August in a season NOAA forecast to be below normal.
What July 23 normally looks like on the Texas coast
Three of these records — Brownsville, Corpus Christi and Palacios — were all set on the same day, July 23, 2008, when Hurricane Dolly came ashore at South Padre Island. Our data picks up its signature cleanly across South Texas. (Houston Hobby's record also falls on that date, but at 0.99 inches and 350 miles away we wouldn't attribute it to Dolly.)
| Station | Wettest July 23 since 1970 | Year | Average July day |
|---|---|---|---|
| Houston Intercontinental | 2.07" | 1990 | 0.12" |
| Port Arthur | 2.27" | 1982 | 0.21" |
| Corpus Christi | 2.86" | 2008 | 0.08" |
| Brownsville | 6.68" | 2008 | 0.08" |
| Palacios | 2.28" | 2008 | 0.15" |
| Houston Hobby | 0.99" | 2008 | 0.16" |
Computed from NOAA GHCN-Daily station records, 1970–2026. You can pull the same numbers for any date and any city on our historical weather lookup.
Every Texas landfall since 1970, ranked by rainfall
Storm-total rainfall at the wettest reporting station within our Texas search box (south of 32°N, east of 99.5°W), computed from our NOAA archive. The “biggest day” column is the heaviest single calendar day at that station. This is the 18 largest landfalls with a clear rain signature — not an exhaustive list of every Texas landfall.
| # | Storm | At TX landfall | Wettest station | Storm total | Biggest day |
|---|---|---|---|---|---|
| 1 | Harvey 2017 | Category 4 | Port Arthur | 47.48" | 26.03" |
| 2 | Allison 2001 | Tropical storm | Houston-Port | 36.45" | 18.40" |
| 3 | Imelda 2019 | Tropical storm | Beaumont City | 31.15" | 19.80" |
| 4 | Claudette 1979 | Tropical storm | Alvin | 27.28" | 25.75" |
| 5 | Allen 1980 | Category 3 | Corpus Christi | 21.64" | 6.93" |
| 6 | Bret 1999 | Category 3 | Port Aransas | 14.50" | 13.89" |
| 7 | Ike 2008 | Category 2 | Liberty | 14.40" | 7.40" |
| 8 | Beryl 2024 | Category 1 | Freeport | 12.39" | 11.26" |
| 9 | Hanna 2020 | Category 1 | Harlingen | 11.54" | 10.64" |
| 10 | Rita 2005 | Category 3 | Center | 10.48" | 8.27" |
| 11 | Alicia 1983 | Category 3 | Mexia | 9.38" | 7.48" |
| 12 | Nicholas 2021 | Category 1 | Freeport | 7.92" | 7.40" |
| 13 | Dolly 2008 | Category 1 | McAllen | 7.85" | 7.78" |
| 14 | Arthur 2026 | Tropical storm | Rockport | 7.53" | 5.24" |
| 15 | Celia 1970 | Category 3 | Robstown | 7.26" | 7.24" |
| 16 | Humberto 2007 | Category 1 | Beaumont City | 6.58" | 6.32" |
| 17 | Claudette 2003 | Category 1 | Refugio | 5.63" | 5.63" |
| 18 | Jerry 1989 | Category 1 | Liberty | 4.75" | 4.60" |
Landfall intensities are NHC public record. Rainfall is measured at NOAA co-op and airport stations — gauge readings at fixed points, not a storm's absolute maximum. Harvey's peak was 60.58" at Nederland; Claudette's was 43" at an unofficial gauge north of Alvin. Two entries sit inland rather than on the coast proper: Alicia's wettest station was Mexia and Rita's was Center, in deep East Texas. One notable storm is missing for the same reason — Tropical Storm Amelia (1978) dropped a reported 48" at Medina in the Hill Country, west of our box; our nearest station, Kerrville, caught 16.58", so we can't rank it here without mixing sources.
Why the category on the news is the wrong number to watch
Run the averages in our own table and the pattern is blunt. The four tropical storms in it average 25.6 inches at their wettest station. The 14 hurricanes average 13.0 inches. The storms too weak to earn a category dropped, on average, nearly twice the rain of the ones that did — because Saffir-Simpson rates sustained wind and nothing else.
Take the two ends. Celia (1970) hit Corpus Christi as a Category 3 and is still remembered as one of the most destructive wind events in Texas history; our Corpus Christi gauge caught 6.38 inches for the whole storm. Allison (2001) never reached hurricane strength at any point in its life. It left 36.45 inches at our Houston-Port station, flooded more than 70,000 homes, killed 40 people and ran up roughly $9 billion in damage — and became the first tropical storm name ever retired without the storm becoming a hurricane.
The variable that actually matters is forward speed. A storm that sprints inland rains for a few hours; one that stalls rains for days. Harvey came ashore near Rockport as a Category 4, but the catastrophe came from the four days it then spent wandering over southeast Texas. Allison did much the same thing at a third of the wind speed and produced a comparable flood.
Which is the useful frame for Bertha. A 45-mph tropical storm sounds like nothing; Imelda came ashore at 40 mph and put 19.80 inches on Beaumont in a single calendar day. The number worth watching this week is the forward speed, not the wind.
Late July is a real Texas landfall window
August and September are the months everyone watches. But the month distribution in our own table is a three-way tie: five landfalls in July, five in August, five in September (plus two in June and one in October). And three of the July arrivals came in the final ten days of the month — Claudette on July 24, 1979; Dolly on July 23, 2008; Hanna on July 25, 2020 — with Bertha's remnants now crossing Texas on July 23, 2026.
Two of those three left a permanent mark. Claudette produced what is still the 24-hour rainfall record for the contiguous United States. Dolly is the reason three of the six stations in our July 23 table hold their wettest reading for the date. Late July is a smaller window than the August–September peak, but it is not a quiet one.
It's also worth noting what this season looks like against the forecast. NOAA called for a below-normal 2026 season — 8 to 14 named storms, with a 55% chance of below-normal activity — on the strength of a developing El Niño. Texas has now taken two landfalls before August anyway. A quiet season is not the same as a quiet coast, which is the point we made in our 2026 hurricane season forecast tracker and the reason we keep saying landfall risk and storm count are different questions.
Dig deeper
We track the 2026 season week by week on our hurricane season 2026 forecast page, including every CSU and NOAA revision. For the long view, our deadliest hurricanes in US history ranking includes the 1900 Galveston hurricane, which killed more Americans than any other natural disaster and still defines how Texas thinks about the Gulf.
Harvey has its own event page with the full Hurricane Harvey track and damage record, and our hurricane history hub maps the historical tracks. Because El Niño is the story behind this season's forecast, our analysis of how El Niño has shaped past hurricane seasons is the companion piece to this one.
For the ground-level view, we keep full records for Houston, Corpus Christi, plus every all-time extreme in the state on our Texas weather records page. Flooding is only half the Texas story — the state also leads the country in recorded tornadoes.
Frequently Asked Questions
How many hurricanes have hit Texas?
Roughly 40 tropical systems have affected the Texas coast since 1970. We ranked the 18 largest by rainfall; 14 of those were at hurricane strength at landfall. Per NOAA's landfall records back to 1851, only Florida is struck more often than Texas.
What was the worst hurricane to hit Texas?
Harvey, August 2017 — a Category 4 landfall near Rockport that then stalled and became the wettest tropical cyclone in US history. Our stations logged 47.48" at Port Arthur and 31.26" at Houston Intercontinental; the storm's peak was 60.58" at Nederland.
Does a higher category mean more rain?
No. Three of the four wettest storms in our ranking — Allison, Imelda and Claudette — were never hurricanes, while Category 3 Celia left about 7". Saffir-Simpson rates wind. Flooding is driven mostly by how slowly a storm moves.
When is hurricane season in Texas?
June 1 to November 30 officially. In our 18-storm table the months are evenly split — five in July, five in August, five in September, two in June, one in October. Claudette (1979), Dolly (2008) and Hanna (2020) all arrived in the last ten days of July.
What is the US record for rainfall in 24 hours?
43 inches, at a gauge just north of Alvin, Texas, from noon July 25 to noon July 26, 1979, during Tropical Storm Claudette. That still stands for the contiguous US; nationally it was passed in 2018 by Waipa Garden, Kauai, at 49.69". Our official Alvin co-op station — a different gauge, some miles away — caught 25.75" on July 25.
Sources & Method
Rainfall totals were computed for this article from NOAA GHCN-Daily station records in our database (1970–present). For each storm we summed daily precipitation across a landfall window at every Texas station on the coastal plain, excluded readings flagged in NOAA's quality-control file, and took the wettest single station. As a check, our Houston Intercontinental figures for Harvey (16.07" on August 27, 2017; 31.26" storm total) match the published NWS values.
Texas is struck by hurricanes more often than any state except Florida, per NOAA's landfall record going back to 1851. Landfall dates and intensities are from the NHC Tropical Cyclone Reports. Storm context follows NWS Houston/Galveston tropical climatology and NOAA WPC's Claudette 1979 rainfall summary (which gives the Alvin storm maximum as 42"; NOAA NCEI certifies the 24-hour value at 43.00"). That 43" figure stood as the national 24-hour record until 2018, when the National Climate Extremes Committee certified 49.69" at Waipa Garden, Kauai; Alvin remains the record for the contiguous United States. Bertha's position and forecast are from NHC Advisory 16, 4:00 a.m. CDT, July 23, 2026, and its landfall time and location from NHC/NWS reporting on July 22. The 2026 seasonal outlook is NOAA's May 2026 release.