A Month’s Rain in a Weekend: The Gulf Coast Flood Threat, Mapped Against the Record
Flood watches run from Louisiana to the Florida Panhandle and up into Southeast Georgia. On the coast the forecast is 3 to 5 inches — close to an entire October, falling in two days.
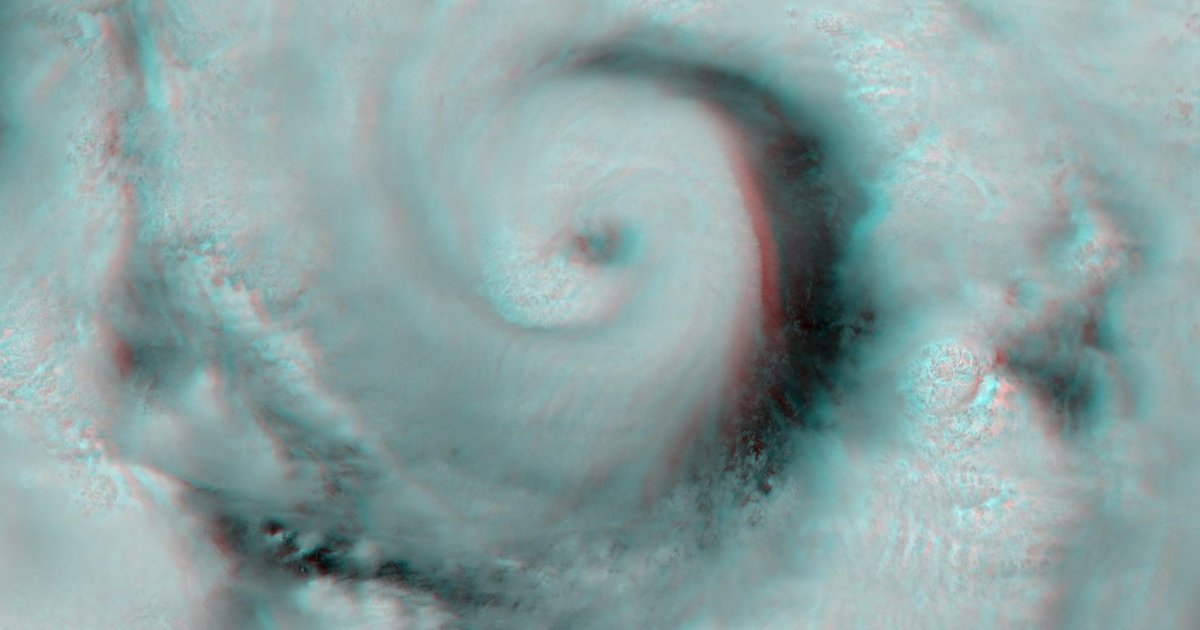
A slow-moving plume of Gulf moisture has put roughly a dozen states under flood watches the first weekend of October 2026, and the sharpest threat is along the Gulf Coast. AccuWeather expects 2 to 3 inches of rain broadly across Louisiana, Mississippi, Alabama and Georgia through Monday, with 3 to 5 inches or more along the southern Louisiana, Alabama and Mississippi coasts and the Florida Panhandle. On that coast, 3 to 5 inches is close to a whole normal October — the month averages 3.2 to 4.8 inches at New Orleans, Mobile, Pensacola and Tallahassee in our 1970–2026 NOAA archive. It is landing in two to three days, onto ground that has already taken days of rain.
There is no hurricane behind it. Forecasters call it a moisture surge: deep tropical air drawn off the Gulf by upper-level energy, pooling against high pressure and training — repeated downpours tracking over the same spots. The NWS office in Jacksonville already had a Flash Flood Watch up along and north of Interstate 10 across all of Southeast Georgia and Northeast Florida, where three to seven inches had fallen in three days before this weekend’s rounds even began. Separately, a second, unrelated plume kept a flood threat alive over the Southern Plains — the leftovers of a wet stretch that set September records from New Mexico to Nebraska.
A weekend of rain where a month usually goes
The number that matters is not the forecast total on its own — it is the forecast total next to the normal. On the central Gulf Coast the two are about the same. New Orleans averages 3.70 inches for all of October; the coast is forecast 3 to 5 inches this weekend. Pensacola averages 4.70; Mobile 3.95; Tallahassee 3.24. When a month’s worth of rain arrives in 48 hours, the problem is not the ceiling but the rate: soil, storm drains and bayous can only move water so fast, and the rest backs up into streets and low-lying neighborhoods.
Southeast Georgia is the clearest example of why antecedent rain matters. Savannah’s ground was already loaded — three to seven inches in three days — when the NWS extended its watch through Monday. Another inch or three on saturated ground runs off almost entirely, which is exactly the setup the watch is written for.
What October can do here, city by city
We pulled every October on record from the primary airport gauge in seven cities in the watch area and ranked it. The table is ordered by each city’s wettest October ever. Read the last two columns together: the records are three to five times the monthly normal, and several of the single-day totals are themselves bigger than the whole forecast for this weekend. October is not a quiet month on this coast.
| City | This weekend (forecast) | Normal (Oct) | Wettest October ever | Wettest October day |
|---|---|---|---|---|
| Savannah, GA | 1–3 in more (locally 5) on top of 3–7 already | 3.72 in | 19.84 in (1994) | 8.94 in (Oct 7, 2016) |
| Pensacola, FL | 3–5+ in | 4.70 in | 17.45 in (2007) | 10.45 in (Oct 4, 1995)Hurricane Opal’s landfall — 31 years ago today |
| Baton Rouge, LA | 2–4 in | 4.84 in | 15.13 in (2015) | 8.60 in (Oct 25, 2015) |
| Jackson, MS | 2–3 in | 3.80 in | 14.67 in (2019) | 6.35 in (Oct 16, 1975) |
| Mobile, AL | 3–5+ in | 3.95 in | 13.45 in (2017) | 4.99 in (Oct 29, 1985) |
| New Orleans, LA | 3–5+ in | 3.70 in | 13.20 in (1985) | 8.67 in (Oct 25, 2015) |
| Tallahassee, FL | 2–4 in | 3.24 in | 11.79 in (1976) | 7.79 in (Oct 7, 1996) |
Normals, record Octobers and record October days are single-station figures from the primary long-record airport gauge in each city, computed October 4, 2026 from NOAA GHCN-Daily (1970–2026), excluding QC-flagged days. Localized storm maxima can run well above the official gauge. Forecast amounts are this weekend’s outlook from AccuWeather and the National Weather Service, not observed totals — gauge data for the event was not yet in the archive at publication.
The storm that set Pensacola’s October record landed 31 years ago today
Pensacola’s wettest single day in any October on record is 10.45 inches, and the date is October 4, 1995 — the day Hurricane Opal came ashore near Pensacola Beach as a Category 3, with 115 mph winds. That is exactly 31 years ago today. It is the kind of event this coast’s October record is built from: a strong Gulf system or its moisture, arriving late in the season when a front is there to squeeze it out.
This weekend is a weaker, slower version of the same physics — no eye, no landfall, just the moisture. That is why the headline risk is flash and urban flooding rather than wind or surge, and why the watches lean on where the ground is already full. If you want the longer record of what the Gulf and the rest of the country have done when the water really piled up, our worst floods in U.S. history ranking and the list of the deadliest hurricanes in U.S. history both lead with Gulf Coast disasters.
If you’re in the watch area through Monday
The danger with a training, slow-moving setup is that totals pile up in a few hours on ground that can’t take it, so the practical rule is simple: never drive into water on a road, day or night — the National Weather Service’s “Turn Around, Don’t Drown” guidance notes a foot of moving water can float most cars, and you can’t see how deep or how fast it is. Rivers and creeks on the Gulf and in Southeast Georgia will keep rising after the rain stops, so the flood threat runs into early next week even where Sunday turns dry.
You can also check your own spot against the record. Look up any day in your town’s past at our weather history lookup, compare your city to the rest of the country in the rainiest cities in America, and track the live watches and warnings on our flood-event tracker. If your rain gauge tops the forecast — or beats your city’s October figure in the table above — we want to hear the number.
Frequently Asked Questions
How much rain will the Gulf Coast get this weekend (October 2026)?
AccuWeather forecasts a general 2 to 3 inches across Louisiana, Mississippi, Alabama, Georgia and the Carolinas through Monday, with 3 to 5 inches or higher along the southern Louisiana, Alabama and Mississippi coasts and the Florida Panhandle. On the central Gulf Coast that 3–5 inches is close to a whole normal October, which runs 3.2 to 4.8 inches at New Orleans, Mobile, Pensacola and Tallahassee in our 1970–2026 NOAA archive.
Which states are under a flood watch?
As of October 4, 2026, flood watches and warnings covered parts of Louisiana, Mississippi, Alabama, Florida, Georgia, Kansas, Missouri, Nebraska, Iowa and Illinois — about a dozen states in two separate zones. The Gulf/Southeast zone is the fresh threat: the NWS in Jacksonville posted a Flash Flood Watch along and north of Interstate 10 covering all of Southeast Georgia and Northeast Florida through early Monday, where 3 to 7 inches had already fallen in three days.
Is a hurricane or tropical storm causing this?
No. There is no named tropical system. Forecasters describe it as a moisture surge — deep tropical moisture pulled north off the Gulf by upper-level energy over the western Gulf, pooling against high pressure and training over the same areas. The Atlantic itself has been quiet, with no hurricane yet this season as of early October.
Why is October such a wet month on the Gulf Coast?
Late-season tropical systems and Gulf-moisture surges collide with the first cold fronts of fall, and the fronts stall. That combination has produced the biggest October totals in our record at every Gulf and coastal-Georgia city we checked — 19.84 inches at Savannah (1994), 17.45 at Pensacola (2007), 15.13 at Baton Rouge (2015). Pensacola’s wettest single October day, 10.45 inches, was Hurricane Opal’s landfall on October 4, 1995 — 31 years ago to the day.
Sources & Method
October normals (1991–2020), the wettest October on record, and the wettest single October day were computed October 4, 2026 from the site’s Neon copy of NOAA’s GHCN-Daily dataset, using the primary long-record airport gauge in each city (1970–present) and excluding readings flagged in NOAA’s quality-control file.
The weekend forecast — a general 2–3 inches with 3–5+ inches on the southern Louisiana, Alabama and Mississippi coasts and the Florida Panhandle, at a Level 2-of-4 flash-flood risk — is from AccuWeather (Oct 3–4, 2026). The Flash Flood Watch for Southeast Georgia and Northeast Florida, and the three-to-seven-inch three-day totals there, are from the National Weather Service in Jacksonville. Hurricane Opal’s October 4, 1995 landfall near Pensacola Beach (Category 3, 115 mph) is from the NHC storm report. Observed totals for this event were not yet in the archive at publication; this page is written in forecast tense and is scheduled for a forecast-to-observed update next week.