Every State's Hottest June on Record, Ranked
We analyzed NOAA weather station records for all 50 states. The result:21 states set their hottest June day in 2012 alone, and 37 of 50 records have fallen since 2010. Only one state's record predates 1980.
June isn't the hottest month for most of the country — that's usually July or August. But June has produced some of the most extreme single-day temperatures on record, driven by early-season heat ridges that catch communities off guard before they've fully adapted to summer. The 2021 Pacific Northwest heat dome hit in late June, killing an estimated 800+ people. The 2012 heat wave set records across 21 states in a single week.
What surprised us most in this data: how modern the records are. Only Rhode Island's 1973 record predates 1980. Every other state set its hottest June day within the last 45 years. That's not a measurement artifact — there are millions of NOAA observations stretching back to the 1940s and earlier. June is simply getting hotter, faster than most people realize.
With the 2026 El Niño confirmed and NOAA projecting above-normal heat for 36 states this summer, understanding which states are most vulnerable to June extremes matters. Here's what 75+ years of data shows.
All 50 States Ranked by Hottest June Temperature
Temperatures from NOAA GHCN-D archive. Airport and Weather Service stations (USW) prioritized for data reliability. Records validated against NOAA State Climate Extremes Committee official ceilings.
| # | State | Temp | Date |
|---|---|---|---|
| 1 | California | 125.6°F | Jun 30, 2013 |
| 2 | Arizona | 123°F | Jun 26, 1990 |
| 3 | Oregon | 118°F | Jun 29, 2021HeatDome |
| 4 | Washington | 118°F | Jun 28, 2021HeatDome |
| 5 | Nevada | 116.9°F | Jun 30, 2013 |
| 6 | Texas | 116.9°F | Jun 27, 1994 |
| 7 | Oklahoma | 116°F | Jun 24, 1980 |
| 8 | Idaho | 114.9°F | Jun 29, 2021HeatDome |
| 9 | Nebraska | 114.9°F | Jun 26, 20122012 |
| 10 | Kansas | 114.9°F | Jun 26, 20122012 |
| 11 | New Mexico | 114°F | Jun 27, 1994 |
| 12 | Utah | 111.9°F | Jun 20, 2017 |
| 13 | Colorado | 111.9°F | Jun 27, 20122012 |
| 14 | South Dakota | 111.9°F | Jun 24, 1988 |
| 15 | Montana | 111°F | Jun 26, 20122012 |
| 16 | North Dakota | 111°F | Jun 29, 2002 |
| 17 | Kentucky | 109.9°F | Jun 29, 20122012 |
| 18 | South Carolina | 109.9°F | Jun 29, 20122012 |
| 19 | Missouri | 109°F | Jun 28, 20122012 |
| 20 | Tennessee | 109°F | Jun 29, 20122012 |
| 21 | Georgia | 109°F | Jun 29, 20122012 |
| 22 | Arkansas | 109°F | Jun 25, 20122012 |
| 23 | Wyoming | 107.9°F | Jun 15, 2021HeatDome |
| 24 | Florida | 107.9°F | Jun 19, 2010 |
| 25 | Iowa | 107.9°F | Jun 21, 1988 |
| 26 | Illinois | 107.9°F | Jun 28, 20122012 |
| 27 | Ohio | 107°F | Jun 28, 20122012 |
| 28 | Alabama | 107°F | Jun 29, 20122012 |
| 29 | Indiana | 107°F | Jun 28, 20122012 |
| 30 | Mississippi | 105.9°F | Jun 29, 20122012 |
| 31 | Maryland | 105.9°F | Jun 29, 20122012 |
| 32 | North Carolina | 105.9°F | Jun 29, 20122012 |
| 33 | Louisiana | 105.9°F | Jun 28, 2009 |
| 34 | Virginia | 105°F | Jun 29, 20122012 |
| 35 | Michigan | 105°F | Jun 28, 20122012 |
| 36 | Minnesota | 105°F | Jun 24, 1988 |
| 37 | West Virginia | 102.9°F | Jun 29, 20122012 |
| 38 | New Jersey | 102.9°F | Jun 30, 2021HeatDome |
| 39 | New York | 102°F | Jun 24, 20252025 |
| 40 | New Hampshire | 102°F | Jun 24, 20252025 |
| 41 | Massachusetts | 102°F | Jun 24, 20252025 |
| 42 | Pennsylvania | 102°F | Jun 29, 20122012 |
| 43 | Wisconsin | 102°F | Jun 21, 1988 |
| 44 | Delaware | 100.9°F | Jun 24, 20252025 |
| 45 | Connecticut | 100.9°F | Jun 24, 20252025 |
| 46 | Maine | 100.9°F | Jun 24, 20252025 |
| 47 | Rhode Island | 100°F | Jun 11, 1973 |
| 48 | Vermont | 100°F | Jun 19, 1995 |
| 49 | Alaska | 96°F | Jun 17, 2013 |
| 50 | Hawaii | 95°F | Jun 28, 2008 |
Rows highlighted: red = 2012 heat wave, orange = 2021 PNW heat dome, amber = June 2025 NE heat wave. Data from NOAA GHCN-D archive, queried June 19, 2026.
The 2012 Heat Wave: One Week, 21 State Records
Look at the table above and a pattern jumps out: 21 of 50 states set their hottest June day between June 25 and June 30, 2012. That's not a coincidence — it was one of the most intense heat waves in American history. A massive ridge of high pressure stalled over the central and eastern US, pushing afternoon temperatures above 100°F from Kansas to South Carolina for five consecutive days.
What made 2012's June heat wave different from typical summer heat: it came with severe drought. The US Drought Monitor showed 56% of the contiguous US in drought that June — dry soils amplify heat because there's no evaporative cooling. Nashville hit 109°F. St. Louis reached 109°F. Bowling Green, Kentucky hit 109.9°F. These aren't desert towns — they're humid southeastern cities where triple-digit heat with high humidity creates genuinely dangerous conditions.
States That Set June Records in 2012
AL, AR, CO, GA, IL, IN, KS, KY, MD, MI, MO, MS, MT, NC, NE, OH, PA, SC, TN, VA, WV — 21 states total. The affected zone stretched from Montana to South Carolina, covering roughly 40% of the contiguous US. Most records were set on June 28–29, when the heat ridge peaked.
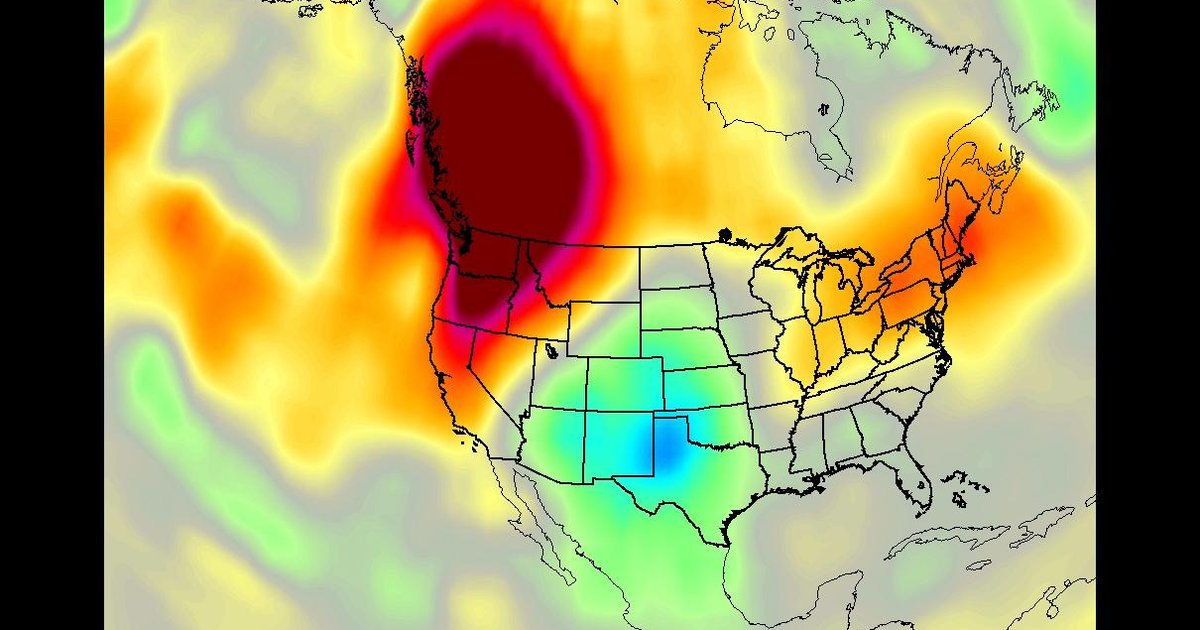
The 2021 Heat Dome: When the Pacific Northwest Hit 118°F
On June 28–29, 2021, Oregon and Washington both recorded 118°F — temperatures that would be extreme in Arizona, let alone the Pacific Northwest. Portland reached 116°F, shattering its previous all-time record of 107°F by nine degrees. Seattle hit 108°F. Lytton, British Columbia, recorded 121.3°F before the town literally burned to the ground the next day.
The heat dome killed an estimated 800+ people across the region. 5 states set their all-time June records during the event: Oregon, Washington, Idaho, Wyoming, and New Jersey (which caught the tail end of a related heat wave on June 30). The event was so far outside historical norms that climate scientists called it “virtually impossible without climate change” — a phrase from the World Weather Attribution study.
When June Records Were Set: The Decade Breakdown
The concentration of records in recent decades isn't a measurement bias — NOAA has maintained reliable weather stations since the 1940s. June is genuinely producing hotter peak temperatures than it did 50 years ago.
| Decade | States Setting Record |
|---|---|
| 1970s | 1 |
| 1980s | 5 |
| 1990s | 3 |
| 2000s | 4 |
| 2010s | 26 |
| 2020s | 11 |
The 2010s alone account for 26 of 50 records — more than all other decades combined. The 2020s already have 11 with four and a half years still to go. Zero states hold June records from the Dust Bowl era (1930s), which dominates July and August record lists. That tells you something about how June heat patterns have shifted.
How June Is Warming: City-Level Trends
Average June daily highs at major airport stations, by decade. The warming isn't uniform — some cities are heating much faster than others.
Seattle's 4.2°F increase is the standout — June days that averaged 68.5°F in the 1970s now average 72.7°F. That doesn't sound dramatic until you consider what happens at the tails of the distribution. A 4°F shift in the average pushes formerly rare 100°F+ days into the realm of the possible — exactly what happened during the 2021 heat dome. Atlanta's 3.6°F increase means more days above 90°F, which matters for a city where summer warming has accelerated since the 1990s.
June 2025 and the New Northeast Heat Pattern
6 states set their hottest June day last year, all on the same date: June 24, 2025. New York, New Hampshire, Massachusetts, Delaware, Connecticut, and Maine all recorded their highest June temperatures at major airports. JFK hit 102°F. Boston hit 102°F. Manchester, NH hit 102°F.
What's notable: these are the kinds of temperatures that used to be associated exclusively with the Midwest and South. When 6 northeastern states simultaneously break June records, it signals a northward expansion of extreme June heat that the broader warming data supports.
June 2026: El Niño Context
NOAA's CPC projects above-normal temperatures for 36 states this summer, with the strongest signal over the Northwest and West. The developing El Niño (now confirmed with a CPC Advisory) typically amplifies summer heat across most of the contiguous US. NOAA's CPC summer outlook shows the strongest above-normal signal over the Northwest and West — the same region where the 2021 heat dome set records that still stand. Whether any June 2026 records fall remains to be seen, but the conditions favor it.
What the Data Reveals That Other Lists Miss
Alaska hit 96°F — in June
Talkeetna Airport recorded 96°F on June 17, 2013 — 5°F short of Alaska's all-time record. Interior Alaska regularly reaches the 80s and low 90s in summer thanks to 20+ hours of daylight and continental heating. But 96°F is exceptional, even for Talkeetna.
Oklahoma's record is from 1980 — the Summer of Hell
While 2012 set records across most of the eastern US, Oklahoma's June record (116°F at Hobart on June 24, 1980) came from the infamous 1980 US heat wave that killed an estimated 1,700 people nationwide. That summer remains the benchmark for extreme heat in the southern Plains.
Every state except Hawaii has hit 96°F+ in June
Hawaii's ocean-buffered climate caps its June record at 95°F (Bradshaw Army Airfield, a high-elevation interior station). Even Alaska has exceeded this. The other 48 states have all recorded at least 100°F in June.
Frequently Asked Questions
What is the hottest June temperature ever recorded in the US?
Why did so many states set June heat records in 2012?
How hot did it get during the 2021 Pacific Northwest heat dome?
Are June temperatures getting hotter across the US?
Which state has the coolest June record high?
Data Sources & Methodology
June monthly temperature records queried from the NOAA GHCN-Daily archive (139M observations across US weather stations). Airport and Weather Service stations (USW prefix) were prioritized for data reliability. Readings were validated against the NOAA State Climate Extremes Committee official all-time records. City decade averages computed from the same archive. 2021 heat dome death toll from WHO and regional health authority estimates. 1980 heat wave death toll from NOAA historical records. Query run June 19, 2026.
Explore State Temperature Records
Look Up Historical Weather for Any City
Search 75+ years of temperature records for 327 US cities. See daily highs, lows, and how today compares to the historical record.
Search Weather History