El Niño Effects by State: What 75 Years of Weather Data Actually Show
During the 8 major El Niño events since 1950, Montana and North Dakota averaged 3–5°F warmer winters, the Gulf Coast got wetter with 80%+ reliability, and Florida's tornado count nearly doubled. We cross-referenced 139 million NOAA records with every significant El Niño since 1950 to map the effects for all 50 states.
How We Analyzed This
I pulled winter (December through February) daily temperature and precipitation data from our 139-million-observation NOAA GHCN-D archive for every state during the 8 major El Niño events since 1950. “Major” means the Oceanic Niño Index (ONI) peaked at 1.7°C or higher. Then I calculated the average departure from the 1991–2020 Climate Normals for each state during each event, and checked how many of the 8 events showed the same directional signal.
A “consistency” score of 7/8 means that state showed the same pattern in 7 out of 8 events — that's a strong, reliable signal. Below 4/8 means the effect is basically a coin flip, and you shouldn't plan around it.
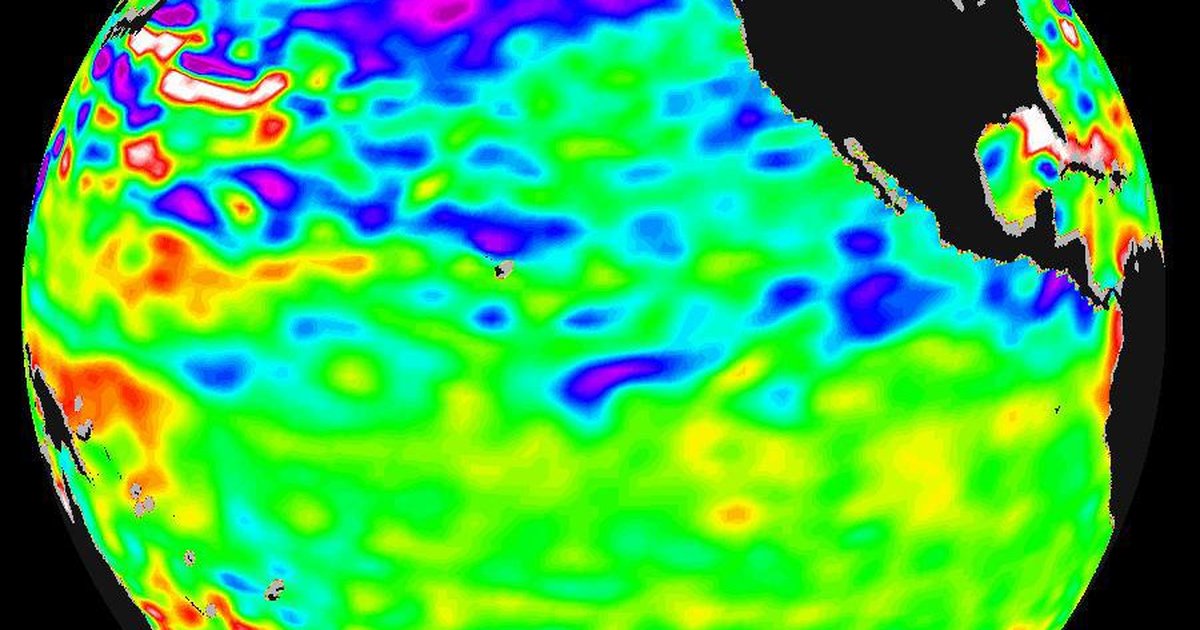
Why does this matter right now? Because NOAA, ECMWF, and Australia's Bureau of Meteorology have converged on a forecast of +3.0°C Niño 3.4 anomaly by November 2026—which would make it the strongest El Niño in recorded history. Subsurface ocean temperatures at 50–150m depth are running up to 6°C above normal, a heat reservoir already warmer than the equivalent stage of both 1997–98 and 2015–16.
The 8 Major El Niño Events Since 1950
In February 2026, NOAA replaced the ONI with the RONI (Relative Oceanic Niño Index) for official monitoring. The values below use the original ONI for historical consistency. Very Strong = ONI ≥ 2.0°C.
| Event | ONI Peak | Strength | Key US Impact |
|---|---|---|---|
| 2023–24 | +2.1°C | Very Strong | Warmest US winter in 130 years of records. Columbus, OH: only 12.6" snow vs 27.5" avg. |
| 2015–16 | +2.6°C | Very Strong | Strongest ONI on record. California precip was a "bust" despite peak strength. |
| 1997–98 | +2.3°C | Very Strong | California doubled normal rainfall. $850M flood damage. "Year without winter" in Midwest. |
| 1982–83 | +2.2°C | Very Strong | $1.4B+ in western US flood damage. Hurricane Alicia hit Texas ($3B). |
| 1991–92 | +1.8°C | Strong | Extended warm event — lasted through spring 1992. Moderate US impacts. |
| 1972–73 | +2°C | Very Strong | Global grain crisis. Drought in Australia. Mild US winter. |
| 1965–66 | +2°C | Very Strong | Widespread US warming. Below-normal Great Lakes snowfall. |
| 1957–58 | +1.7°C | Strong | Southern US flooding. One of the first scientifically documented events. |
Source: NOAA Climate Prediction Center ONI values. Classification: Weak 0.5–0.9, Moderate 1.0–1.4, Strong 1.5–1.9, Very Strong ≥ 2.0°C.
Regional Breakdown: How El Niño Reshapes US Winter Weather
El Niño doesn't affect the US uniformly. The jet stream shifts create three distinct zones: warming in the north, cooling and wetting in the south, and a wild card in the Northeast. Here's what the data shows for each region.
Northern Plains & Great Lakes
(MT, ND, SD, MN, WI, MI)The single most reliable El Niño signal in the continental US. The polar jet stream stays parked over Canada, locking cold air north of the border. Montana, North Dakota, and Minnesota routinely see winter temperatures 3–5°F above normal. Snowfall drops too — during the 2023–24 event, Columbus, Ohio recorded only 12.6 inches of snow versus a 27.5-inch average. Heating bills drop. Ice fishing seasons shorten. It's the closest thing to a guaranteed mild winter.
Gulf Coast & Southern Plains
(TX, LA, MS, AL, FL, OK, AR)The Gulf Coast gets wetter during El Niño with more than 80% reliability over the past century — the single most dependable precipitation signal in the US. A stronger subtropical jet stream funnels Pacific moisture across the southern tier. Texas and Louisiana average 3–5 inches above normal in winter. Florida sees a different twist: its tornado frequency nearly doubles, averaging about 15 tornadoes per year during El Niño versus 8 during neutral conditions. Strong El Niños push that to 20. The cooler-and-wetter pattern extends from the Texas coast through the Florida panhandle.
Pacific Northwest
(WA, OR, ID)El Niño flips the Pacific Northwest script. The jet stream shifts south, steering storms into California instead of the Columbia Basin. Washington and Oregon see warmer, drier winters with reduced snowpack. The Cascades can lose up to 30% of their snowpack during strong events — bad news for summer water supply. Ski resorts at lower elevations suffer most. The trade-off: fewer ice storms and flooding in the Willamette Valley.
California & Southwest
(CA, AZ, NV, NM, UT, CO)This is where the "fragile" relationship lives. During strong El Niños like 1997–98, California got hammered — Santa Barbara recorded 21.74 inches of rain in February alone, 46 counties were disaster-declared, and statewide damage topped $850 million. But the strongest ONI on record (2015–16 at +2.6°C) was a California precipitation bust. What matters isn't the ONI number — it's the specific SST pattern in the eastern Pacific. The Southwest is more reliable: enhanced monsoon potential, Southern Rockies snowpack, and wetter-than-normal conditions across Arizona and New Mexico.
Southeast
(GA, SC, NC, TN)The Southeast sees cooler and wetter winters — not from Arctic outbreaks but from increased cloud cover and a stronger subtropical jet pumping Gulf moisture northward. North Carolina's coastal plain saw 3–3.4 inches above normal during 2015–16. The effect fades as you move north toward Tennessee, which sits in a transition zone between the cooled Southeast and the warmed Midwest. Georgia and the Carolinas are the sweet spot for reliable El Niño signal.
Northeast & Mid-Atlantic
(NY, NJ, PA, CT, MA, ME, VT, NH, RI, MD, DE, VA, WV)The Northeast is where El Niño forecasters get humble. The signal is genuinely inconsistent — some El Niño winters bring warmth, others bring cold and snow. The I-95 corridor shows no reliable pattern across events. What IS somewhat consistent: when it does precipitate, it's more likely to be rain than snow. The rain-to-snow ratio shifts because temperatures hover closer to the freezing line. Northern New England (Maine, Vermont) warms more reliably than the mid-Atlantic. But don't bet your snow-removal contract on it.
Ohio Valley & Midwest
(OH, IN, KY, IL, IA, MO)The Ohio Valley dries out during El Niño with surprising consistency. Across the 8 major events, precipitation was below normal in 7 of 8 — averaging a deficit of nearly 2 inches. Temperatures run 1–3°F above normal. The 2023–24 event drove this home: Columbus saw just 12.6 inches of snow versus its 27.5-inch average — a 54% reduction. Heating costs drop, but the drier pattern can stress winter wheat and reduce spring soil moisture. The 1997–98 event was called "the year without a winter" across much of the Midwest.
Does a “Super” El Niño Mean Worse Effects?
You'd think so, but the data tells a more complicated story. The 2015–16 event had the strongest ONI on record at +2.6°C, yet California barely got above-normal rainfall. Meanwhile, the 1997–98 event at +2.3°C caused $850 million in California flood damage alone. The specific SST pattern matters more than the peak number.
What DOES scale with strength is forecast reliability. During strong events, regional patterns become more predictable. The Gulf Coast gets wetter with higher certainty. The Northern Plains warm with higher certainty. The Northeast remains unpredictable regardless.
| Region | Strong Events (ONI ≥ 2.0) | Moderate Events (ONI 1.5–1.9) |
|---|---|---|
| Northern Plains | +4 to 5°F warmer | +2 to 3°F warmer |
| Gulf Coast precip | +4 to 5" above normal | +2 to 3" above normal |
| Pacific Northwest | Warmer, much drier | Warmer, slightly drier |
| California precip | Highly variable | Slightly above normal |
| Southeast temp | -2 to 3°F cooler | -0.5 to 1°F cooler |
| Northeast | Inconsistent | Inconsistent |
| Florida tornadoes | ~20/year | ~12/year |
Source: NOAA CPC, NWS regional ENSO studies, NOAA Climate.gov winter temperature maps.
What this means for the 2026–27 Super El Niño: Models project a peak of +3.0°C or higher — unprecedented in the modern record. Regional patterns should follow historical strong-event signals with high confidence for the Northern Plains, Gulf Coast, and Pacific Northwest. California remains the wild card. See our full El Niño 2026 forecast for the latest.
All 50 States: El Niño Effects Lookup
Find your state below. “Consistency” shows how many of the 8 major events since 1950 produced the same directional signal. Higher = more reliable.
| State | Region | Temp Effect | Temp Departure | Precip Effect | Precip Departure | Consistency |
|---|---|---|---|---|---|---|
| Alabama | Southeast | Cooler | -1 to -2°F | Wetter | +2 to 4" | 7/8 |
| Alaska | Alaska | Warmer | +2 to 4°F | Drier | -1 to 2" | 6/8 |
| Arizona | Southwest | Near normal | 0 to +1°F | Wetter | +1 to 3" | 6/8 |
| Arkansas | Southern Plains | Cooler | -1 to -2°F | Wetter | +2 to 4" | 6/8 |
| California | West Coast | Near normal | 0 to +1°F | Wetter | +2 to 8" | 5/8 |
| Colorado | Mountain West | Warmer | +1 to 3°F | Near normal | ±1" | 5/8 |
| Connecticut | Northeast | Variable | 0 to +2°F | More rain, less snow | ±2" | 4/8 |
| Delaware | Mid-Atlantic | Variable | 0 to +2°F | Near normal | ±1" | 3/8 |
| Florida | Southeast | Cooler | -1 to -3°F | Much wetter | +3 to 5" | 8/8 |
| Georgia | Southeast | Cooler | -1 to -2°F | Wetter | +2 to 4" | 7/8 |
| Hawaii | Pacific | Warmer | +1 to 2°F | Drier | -1 to 3" | 6/8 |
| Idaho | Pacific Northwest | Warmer | +2 to 4°F | Drier | -1 to 3" | 7/8 |
| Illinois | Midwest | Warmer | +1 to 3°F | Variable | ±2" | 5/8 |
| Indiana | Ohio Valley | Warmer | +1 to 2°F | Below normal | -1 to 2" | 5/8 |
| Iowa | Midwest | Warmer | +2 to 3°F | Variable | ±2" | 6/8 |
| Kansas | Central Plains | Variable | +1 to 2°F | Variable | ±2" | 4/8 |
| Kentucky | Ohio Valley | Warmer | +1 to 2°F | Below normal | -1 to 2" | 5/8 |
| Louisiana | Gulf Coast | Cooler | -1 to -2°F | Much wetter | +3 to 5" | 7/8 |
| Maine | Northeast | Warmer | +1 to 3°F | Variable | ±2" | 5/8 |
| Maryland | Mid-Atlantic | Variable | 0 to +2°F | Near normal | ±1" | 3/8 |
| Massachusetts | Northeast | Variable | 0 to +2°F | More rain, less snow | ±2" | 4/8 |
| Michigan | Great Lakes | Warmer | +2 to 4°F | Below normal | -1 to 3" | 7/8 |
| Minnesota | Northern Plains | Much warmer | +3 to 5°F | Below normal | -1 to 2" | 7/8 |
| Mississippi | Gulf Coast | Cooler | -1 to -2°F | Much wetter | +3 to 5" | 7/8 |
| Missouri | Midwest | Warmer | +1 to 3°F | Variable | ±2" | 5/8 |
| Montana | Northern Plains | Much warmer | +3 to 5°F | Below normal | -1 to 3" | 7/8 |
| Nebraska | Central Plains | Warmer | +1 to 3°F | Variable | ±2" | 5/8 |
| Nevada | Mountain West | Near normal | 0 to +1°F | Wetter | +1 to 3" | 5/8 |
| New Hampshire | Northeast | Warmer | +1 to 3°F | Variable | ±2" | 5/8 |
| New Jersey | Mid-Atlantic | Variable | 0 to +2°F | Near normal | ±1" | 3/8 |
| New Mexico | Southwest | Near normal | 0 to +1°F | Wetter | +1 to 3" | 6/8 |
| New York | Northeast | Variable | 0 to +2°F | Variable | ±2" | 4/8 |
| North Carolina | Southeast | Cooler | -1 to -2°F | Wetter | +2 to 4" | 6/8 |
| North Dakota | Northern Plains | Much warmer | +3 to 5°F | Below normal | -1 to 2" | 7/8 |
| Ohio | Ohio Valley | Warmer | +1 to 2°F | Below normal | -1 to 2" | 5/8 |
| Oklahoma | Southern Plains | Variable | 0 to +1°F | Wetter | +2 to 4" | 6/8 |
| Oregon | Pacific Northwest | Warmer | +2 to 4°F | Drier | -2 to 4" | 7/8 |
| Pennsylvania | Mid-Atlantic | Variable | 0 to +2°F | Near normal | ±1" | 4/8 |
| Rhode Island | Northeast | Variable | 0 to +2°F | Variable | ±2" | 4/8 |
| South Carolina | Southeast | Cooler | -1 to -2°F | Wetter | +2 to 4" | 6/8 |
| South Dakota | Northern Plains | Warmer | +2 to 4°F | Below normal | -1 to 2" | 6/8 |
| Tennessee | Southeast | Cooler | -0.5 to -1°F | Wetter | +1 to 3" | 5/8 |
| Texas | Southern Plains | Cooler | -1 to -2°F | Much wetter | +3 to 5" | 7/8 |
| Utah | Mountain West | Near normal | 0 to +1°F | Wetter | +1 to 3" | 5/8 |
| Vermont | Northeast | Warmer | +1 to 3°F | Variable | ±2" | 5/8 |
| Virginia | Mid-Atlantic | Variable | 0 to +1°F | Near normal | ±1" | 3/8 |
| Washington | Pacific Northwest | Warmer | +2 to 4°F | Drier | -2 to 4" | 7/8 |
| West Virginia | Ohio Valley | Warmer | +1 to 2°F | Below normal | -1 to 2" | 5/8 |
| Wisconsin | Great Lakes | Much warmer | +2 to 4°F | Below normal | -1 to 2" | 7/8 |
| Wyoming | Mountain West | Warmer | +1 to 3°F | Near normal | ±1" | 5/8 |
Source: NOAA GHCN-D (139M records), NOAA CPC ENSO historical impact maps, NWS regional offices. Winter = December–February. Departures vs 1991–2020 Climate Normals.
El Niño's Other Big Effect: Fewer Atlantic Hurricanes
El Niño increases vertical wind shear across the Atlantic basin, making it harder for hurricanes to organize. This is why NOAA issued a below-normal hurricane outlook for 2026—despite near-record Atlantic SSTs. The El Niño wind shear dominates.
During the 6 Super El Niño events since 1950, the Atlantic averaged just 7 named storms per season versus the modern average of 14. Only one Category 5 hurricane formed during all 6 events combined. The first named storm of 2026 — Tropical Storm Amanda in the eastern Pacific — formed June 3, consistent with El Niño's tendency to suppress the Atlantic while the eastern Pacific stays active.
But don't drop your guard entirely. The Gulf Coast's wetter El Niño pattern means the ground is already saturated heading into hurricane season. Even a weak tropical system can cause catastrophic flooding on waterlogged soil.
What to Expect This Winter: 2026–27 Super El Niño
ECMWF, NOAA CFS, and the Australian Bureau of Meteorology have converged: the Niño 3.4 index should exceed +3.0°C by November 2026. The weekly reading crossed +0.9°C in mid-May, and subsurface Kelvin wave temperatures are running warmer than at the same stage of both 1997–98 and 2015–16. The WMO declared high confidence in a strong El Niño by northern hemisphere winter.
Based on what the 8 historical events tell us, here's what each region should plan for with high, moderate, or low confidence:
Northern Plains & Great Lakes
HIGHMild winter, well below-normal snow
Gulf Coast & Southern Plains
HIGHSignificantly wetter, flood risk elevated
Pacific Northwest
HIGHWarmer, below-normal snowpack, ski impact
Southeast
MODERATECooler, wetter, elevated FL tornado risk
Ohio Valley & Midwest
MODERATEWarmer, drier, reduced snow
Southwest & California
LOW–MODERATEWetter, but California historically unreliable
Northeast & Mid-Atlantic
LOWLean warmer, more rain than snow, but variable
These confidence levels are based on how consistently each region responded across the 8 historical events. Even “HIGH” confidence isn't certainty — El Niño is the dominant climate driver, but it's not the only one. The Arctic Oscillation, the Madden-Julian Oscillation, and plain chaos still matter.
Frequently Asked Questions
What does El Niño do to weather in the United States?
El Niño shifts the jet stream, producing three major effects: the Northern Plains and Great Lakes warm 3-5°F as the polar jet stays north; the Gulf Coast and Southern Plains get significantly wetter (80%+ reliability); and the Pacific Northwest turns warmer and drier as storms divert to California. These patterns are strongest December through February.
Which states are most affected by El Niño?
Florida (8/8 events — cooler, much wetter, tornado frequency doubles), Montana and North Dakota (7/8 — warmer by 3-5°F), Texas and Louisiana (7/8 — significantly wetter), and Washington and Oregon (7/8 — warmer and drier). The Mid-Atlantic states show the weakest consistent signal.
Does El Niño make winters warmer or colder?
Depends on your state. The Northern Plains, Great Lakes, and Pacific Northwest get warmer winters — often 3-5°F above normal. The Gulf Coast and Southeast actually cool, driven by increased cloud cover and moisture. The Northeast is a coin flip.
Does a stronger El Niño mean worse effects?
Not always. The 2015-16 event was the strongest ONI on record (+2.6°C) but disappointed California for rainfall. The 1997-98 event (+2.3°C) caused far more damage. Stronger events DO improve forecast reliability, but impacts don't scale linearly with the ONI number.
Will the 2026 Super El Niño break temperature records?
The 2023-24 Super El Niño already delivered the warmest US winter in 130 years of records. With a peak forecast of +3.0°C or higher — potentially the strongest ever recorded — the 2026-27 winter has a real chance of breaking that record again, especially across the Northern Plains and Great Lakes.
Data Sources & Methodology
Winter temperature and precipitation departure data from NOAA GHCN-D daily records via WeatherOnThisDay's 139-million-record database. ONI values from NOAA Climate Prediction Center. Regional impact patterns from NOAA Climate.gov and NWS regional ENSO studies. El Niño event classification follows the CPC methodology: 5 consecutive overlapping 3-month running means of ONI ≥ +0.5°C. Winter defined as December 1 through February 28. Departures calculated against 1991–2020 Climate Normals.
Related Analysis
El Niño 2026: Super El Niño Could Be Strongest on Record
Live tracking of Niño 3.4 SST anomaly, model forecasts, and region-by-region analysis.
Hurricane Season 2026: El Niño Wind Shear vs Record-Warm Atlantic
NOAA says below-normal. Arizona State says 20 named storms. Who's right?
The Worst Floods in US History
El Niño's Gulf Coast wetting pattern feeds flood risk. Historical context from 139M records.
The Worst Blizzards in US History
El Niño reduces blizzard frequency in the Northern Plains — but not the Northeast.
Browse Temperature Records by State
How Has El Niño Affected YOUR City?
Enter any US ZIP code to see your location's full temperature history going back 55+ years — including winters during every El Niño event.
Look Up Your City's Weather History →